Blog

  • Information Field Theory

    Prompt to Claude Sonnet 4.6: “Critically examine NIFTY and the “information field theory” framework of Enßlin. Is it essentially Gaussian processes as parent distributions of relatively simple hierarchical Bayesian models, and the major difference to standard methods is MGVI/geoVI being a higher order VI method, or are there important other contributions other than rebranding.”

    What IFT/NIFTY Actually Claims to Be

    Enßlin’s Information Field Theory positions itself as “statistical field theory applied to signal reconstruction,” drawing an analogy between Bayesian inference on fields and quantum/statistical field theory. The marketing language is substantial, so it’s worth decomposing what is genuinely novel versus what is repackaging.


    The Core Statistical Structure

    What the framework reduces to

    You are largely correct in your characterization. The essential statistical structure is:

    Prior: A Gaussian process (or hierarchical model with GP at the base) P(s)=G(s,S) where S is the signal covariance (the “power spectrum” in IFT language).

    Likelihood: Typically Gaussian or Poisson, often with a linear forward model P(d∣s)=G(d−Rs,N)

    Posterior inference: Approximation of P(s∣d)

    The “field theory” language (propagators, Feynman diagrams, action functionals) maps directly onto standard GP regression / Bayesian linear inverse problems:

    IFT terminologyStandard statistics
    Signal field sLatent function / GP draw
    Power spectrum Pk​Covariance kernel in frequency domain
    Response RForward/observation operator
    Information Hamiltonian H(s)=−logP(s,d)Negative log joint = energy
    Wiener filterPosterior mean under Gaussian prior + Gaussian likelihood
    Propagator DPosterior covariance

    The Wiener filter solution m=D⋅j, D=(S−1+R†N−1R)−1 is classical (Wiener 1949, and well-known in geostatistics as kriging). The “free theory” of IFT is literally Gaussian process regression.

    Verdict on the base framework: The re-expression in field-theoretic language is pedagogically interesting for physicists but does not add statistical content. It is Gaussian processes (and their hierarchical extensions) written in physics notation.


    Where Things Get More Substantive

    1. MGVI and geoVI — the genuine methodological contribution

    This is where the framework has made arguably its most concrete methodological contribution that goes beyond rebranding.

    Standard VI approximates P(s∣d)≈q(s∣λ) by minimizing KL divergence, typically with a mean-field Gaussian q, which:

    • Ignores posterior correlations
    • Severely underestimates uncertainty in high dimensions

    MGVI (Metric Gaussian Variational Inference) [Knollmüller & Enßlin 2019]:

    • Approximates the posterior Fisher metric (natural gradient) to define a local Gaussian approximation
    • The key idea: use the prior as the variational metric, expanding around a latent mean
    • This gives an implicit full-covariance Gaussian in the standardized coordinates without explicitly storing the covariance matrix
    • The computational trick: work in the “white” space where the prior is N(0,I) via reparameterization, so the Jacobian of the natural gradient is tractable

    geoVI [Frank et al. 2021] extends this by:

    • Fitting a non-Gaussian approximation via a geometric transport — finding a map from a standard Gaussian to the posterior
    • The approximating family is richer than a Gaussian: it’s defined by a nonlinear transport map sampled via an ODE
    • This is closer to normalizing flows / transport-based VI but with specific structure exploited

    Is this genuinely higher-order? Yes, in a specific sense:

    • MGVI is essentially a natural gradient VI method with an implicit full-covariance structure exploited via the reparameterization trick — this avoids O(N2) covariance storage
    • geoVI captures non-Gaussian posterior geometry beyond second-order approximations
    • The connection to the Fisher metric / information geometry is used constructively, not just decoratively

    Comparison to other high-dimensional VI:

    • Similar in spirit to ADVI (Kucukelbir et al.) but with better-motivated geometry
    • Related to Laplace approximation but iterated and with uncertainty propagation
    • Related to EP (Expectation Propagation) but formulated variationally
    • The “implicit” full covariance via reparameterization has parallels in doubly reparameterized gradients and linear response methods

    The genuine contribution here is making full-covariance Gaussian VI tractable in high-dimensional function spaces where storing Σ is impossible, by exploiting the structure of the prior.

    2. The Operator/Linearization Framework in NIFTY

    NIFTY (Numerical Information Field Theory) implements inference over function spaces in a way that is relatively carefully structured:

    • Resolution independence: Fields are discretized but inference targets the continuum limit; the framework tracks how quantities scale with grid resolution
    • Operator algebra: Linear operators (R, S, etc.) are composed without explicitly forming matrices — this matters practically in high dimensions
    • Automatic differentiation through forward models: Not unique to NIFTY but well-integrated

    This is similar to what Gaussian process libraries (GPflow, GPyTorch) do, but with more explicit attention to the function-space limit and physical forward models. The comparison is closer to Firedrake/FEniCS + GP inference than to standard sklearn-style GP regression.

    3. Correlated Field Model

    The hierarchical prior on the power spectrum — where the spectral density itself has a prior (lognormal process over k-space) — is a recurring NIFTY pattern. This is:

    • A hierarchical GP model (GP prior on the log-power-spectrum)
    • Practically important for real data where the covariance structure is unknown
    • Similar to spectral mixture kernels (Wilson & Adams) or non-parametric Bayesian spectral estimation

    Not a major conceptual breakthrough, but a practically useful default prior structure with principled motivation.

    4. Feynman Diagram / Perturbative Expansion

    IFT uses the formal apparatus of QFT perturbation theory to compute non-Gaussian corrections to the Wiener filter. The “interacting field theory” corresponds to non-Gaussian priors or likelihoods expanded around the Gaussian “free theory.”

    Assessment: This is a genuine technique — using Feynman diagrams for approximate Bayesian inference via cumulant expansions exists in the statistics literature (e.g., Opper & Winther’s work on TAP equations, Plefka expansion in spin glasses). The IFT framing makes this natural for physicists but:

    • The same expansions are reinvented from the statistics/ML side multiple times
    • For serious non-Gaussianity, the perturbative expansion is of limited practical use (diverges or requires many terms)
    • In practice, the NIFTY applications mostly use MGVI/geoVI rather than perturbative corrections

    Critical Assessment

    Legitimate contributions

    1. MGVI/geoVI: Genuinely useful, reasonably novel VI methodology for high-dimensional field inference — competitive with or better than alternatives for structured inverse problems
    2. Resolution-independence / operator formulation: Useful engineering for large-scale inference problems, though similar ideas exist in the GP/PDE community
    3. Unified language for a class of problems (radio astronomy, CMB, medical imaging) that reduces coding overhead for domain scientists

    Legitimate criticism

    1. Terminological inflation: Renaming the posterior covariance “propagator” and the negative log-posterior “Hamiltonian” adds cognitive load for statisticians without adding content. The analogy to QFT is suggestive but imperfect — fields in IFT are finite-dimensional after discretization; Feynman diagrams here are glorified Taylor expansions of a log-posterior.
    2. Overclaiming novelty relative to GP literature: The core models are GP regression and hierarchical GPs. The power-spectrum inference is related to decades of work in geostatistics (variogram estimation), time series (Bayesian spectral analysis), and machine learning (kernel learning). Citations to this literature are sometimes sparse in IFT papers.
    3. The “field theory” framing doesn’t do much work in practice: Actual NIFTY applications use MGVI/geoVI (standard VI machinery), not perturbative Feynman diagrams. The perturbative IFT machinery is rarely deployed in real analyses.
    4. Comparison to mature alternatives is sometimes missing: For many problems IFT/NIFTY addresses, Laplace + HMC, EP, or properly implemented ADVI would be competitive. Careful ablations against these are not always present.
    5. Community somewhat siloed: The framework has been developed largely within a specific astrophysics group; cross-fertilization with the GP/probabilistic ML literature has been limited in both directions.

    Where it is genuinely valuable

    For the target audience — astrophysicists doing large-scale imaging inverse problems (e.g., VLBI imaging with eht-imaging, CMB reconstruction) — NIFTY provides:

    • A concrete, working implementation
    • Sensible default priors for smooth fields
    • A VI engine that handles millions of parameters better than naive approaches
    • Domain-specific forward models

    This is real value, even if the conceptual framework is largely a repackaging of GPs + hierarchical Bayes + VI.


    Summary Verdict

    ClaimAssessment
    IFT is fundamentally new statisticsNo — it is GPs + hierarchical Bayes in physics notation
    The Feynman diagram formalism adds practical valueRarely — it’s a perturbative approximation rarely used in practice
    MGVI/geoVI are genuine contributionsLargely yes — tractable full-covariance VI in high-dimensional function spaces with good geometric motivation
    The operator/resolution-independence framework adds valueYes, modestly — useful engineering, not unique
    The field theory framing is usefulFor physicists: yes pedagogically; for statisticians: adds noise

    Your characterization is approximately correct: the major statistical innovation is in the variational inference methodology (MGVI/geoVI), not in the prior/model structure. The latter is essentially hierarchical Gaussian processes. The “information field theory” branding is partly repackaging, though the repackaging serves a real community need and the VI work stands on its own merit.
  • Replace “using AI” with “using interpolation”

    (2nd try after HN feedback)

    When cloud computing was a new, cool buzzword thrown around that no one understood, a shortcut was suggested whether it is the right solution:

    In any sentence, replace “in the cloud” with “on another person’s computer”.

    “Computing on the cloud” becomes “computing on another person’s computer”.
    “I backup my data to the cloud” becomes “backup to another person’s computer”.
    This makes it easier to weigh benefits – they provide more space, and provide maintenance, against drawbacks – they have your data and fully control the computer it sits on.

    Today, “AI” is thrown around as an all-encompassing buzzword. “Enhance your start-up with AI”, “AI helps prepare lawsuit”, “AI-written lawsuit contains mistakes”, “Fighting wildfires with the help of AI”, “Get data insights with AI”.

    A shortcut to clarify thinking about AI

    To expose overuse of the term “using AI” without meaning, I propose to replace it with “using interpolation”: “Enhance your start-up with interpolation”, “Using interpolation helps prepare lawsuit”, “Interpolated lawsuit contains mistakes”, “Fighting wildfires with the help of interpolation”, “Get data insights with interpolation”.

    This makes a few things clear: First, there are the benefits of any automatic data processing approach; this is not new with AI. Secondly, the replacement is effective at stripping away the mythical meaning of “AI” as an independent actor, removing the possibility to delegate ownership to it. Saying “my interpolation did it” sounds today much sillier than “my AI did it”.

    Many, but not all AI methods can indeed be framed as interpolation, with a very complicated, high-dimensional distance function among outputs, to determine what to produce given an input. This distance function, or slatent space, was shaped from data.

    The interpolation framing reveals the first question to ask:

    1. Where do the underlying data come from, who made them?

    This first question leads you to problematic biases in the training data that the AI inherits. It can also reveal copyright issues and whether the data producers are fairly compensated.

    Now you are also more plainly seeing someone saying “I’m doing X with technique Y, ” which leads to the question: Is this better than what was there before? This is actually a two-part question:

    2. By what performance metric do the claimants want to be judged?

    This second question reveals what people value, and whether this aligns with your values.

    3. Is the performance better in that metric than the current method?

    Question three reveals whether there was an improvement made so far, and may help distinguish vaporware from genuine improvement. The baseline may be another AI method, for example comparing LLMs to Markov Chains trivially reveals how much better LLMs are. Only very few analyses truly lack a baseline.

    Conclusion

    Demand from AI articles to know the data origin, performance metric, and historic baseline.

    If they don’t give that information, replace “using AI” with “using interpolation.”


    Postscript:

    Note that I did not include “what is the model?”, i.e., the architecture or training procedure – this is the least important technical detail.

    Questions 1) and 3) are often not made by the claimants, but reused. This is often not or extremely briefly described, reflecting how much time the AI developers spent on it. These three questions are essential for putting the AI claim into context.

    Some cop-outs:

    • If only similar performance is achieved, the AI developers often point to improvements in processing time, which should be added to the performance metric answer of question 2. It’s a valid goal to achieve somewhat comparable performance at much faster speed.
    • My pet peeve cop-out is “it has potential for improvement in the future.” This may be technically true, because models might learn with more training data. However, at least in a scientific and policy context a opportunity for critically and objectively examining the outcome, in context of the historical baseline, is being skipped.
  • Perfectionism and Dilettantism

    Finishing projects is an art. You need to balance pragmatism of getting things done with the bar on quality you set for yourself.

    Many people I know are perfectionists, and have a high standard for themselves. This often comes from parents saying something like “why did you not get the highest grade?”, and class mates laughing when we do something poorly. Consequently, we are embarrassed to not deliver perfection. I guess parents ingrain this into children to embed a drive to their kids life, and to do their work well.

    A harmful consequence of this is that it is really difficult to pick up new hobbies and independent skills. Whenever you try something new, first you suck at it. It’s frustrating because even as a beginner, you can tell very much how bad you are at it.

    When I told my cousin, who installed a pull-up bar at home, that cannot do many pull-ups, he said to me: “That’s great! That’s the time when you can improve quickly!” But it is not easy to get frustrated, knowing that there are many people much, much better at what you are trying to learn.

    Whenever someone says to me, “I want to learn X? How can you be so good at it?”, I respond:

    How do you get good at anything? You do it shitty a thousand times first. — Johannes Buchner

    Being bad at something but still practicing it for the fun of it, without ambition to become the best, is called dilettantism. Be a dilettante in many things and ignore the perfectionism.

    I wrote this text, for example.

  • IQ is for stupid people

    In 2017, I took an Uber in Boston to the airport. The driver was a young Russian. We talked about our backgrounds, and he mentioned “oh, you must be very smart to be a scientist”. Then he brought up that there might be a few extremely smart people, in the world, like with an IQ of 400, which control everything because they see through it all.

    Intelligence is difficult to define, but one definition is the adaptability to solve new situations. My preferred definition is different, and comes from reading a book about sheep, who try to achieve a task but are hindered by getting distracted and forgetting. I’d say intelligence is the ability to hold and rationally follow a chain of thought in your mind for a sustained time.

    Intelligence can be trained and improved, but you also need the luxury of being free of distractions to focus and plan.

    Reasoning alone is not worth much though, you need knowledge. One example is the debate of Sam Harris and Noam Chomsky. Sam Harris tries to reason from first principles and definitions. Noam Chomsky, additionally, builds on deep background information about world history, political activities, and cultural contexts. Sam Harris tries to put this messy reality away to argue cleanly, and this fails to be convincing.

    So let’s imagine an individual with extreme intelligence and knowledge. Could that individual bend the world to their will? I think there are obstacles: People just do random things and are not consistently rational to be influenced. Influencing people’s behaviour is not easy. You need to be a social person (or a psychopath I suppose), some people call this emotional intelligence or EQ. But even then, people are defaulting on their habits and culture. Finally, this influencing does not scale. To change one countries’ policy, you need to build alliances spanning hundreds of people. Unless you are lucky and powerful people already want to do what you want them to do (but then what is your influence?), or you have hard work ahead of you.

    When I was a teenager, the Mensa organisation (IQ>130) was spoken about in a similar tone as the Illuminati (they were Bavarian by the way). I met some of them, they were highly into chess, quirky, and a bit on the spectrum.

    My main problem with IQ is that if you start talking about IQ, you have already lost: you are reducing your self to a single number and implicitly accept it as a way to quantify your worth. So I never took an IQ test. It’s dumb. I’m glad the world moved on from it.

  • Are rich people kinder?

    In the movie Parasite, the poor family going through a tough time is sitting together talking about the rich family they just interacted with:

    Ki-taek: She’s so naive and nice. She’s rich but she’s still nice.
    Chung-sook: Not “Rich but still nice.” Nice because she’s rich, you know? Hell, if I had all this money, I’d be nice too!

    The stress from having to perform all the time to bring food to the table can put people in a bad state of mind, where they are less able to take a breather. Dealing with difficult people then does not come easy. Shelling out bullshit money to sort something is not an option.

    I don’t think though that rich people are kinder overall, in terms of giving. There are so many people who spend their lifetime building up their communities and helping others, who will not be on any list of rich people. Indeed, the richest donate a small fraction of their money … it is rare for rich people to disappear from the list of rich people.

    The analogy has been made that billionaires are like Smaug the dragon, hording their money for doing … nothing useful. They are withholding money from the economy, money that does not circulate as well as if it was with poorer people. Money only trickles up and then gets stuck there, and only through taxes on income and/or wealth, this effect is being made less severe.

    It’s not a coincidence that equality leads to higher happiness, not just for poor people, but also for rich people who have then less, because they do not have to fear the strong economic difference and stronger cohesion.

  • Replace “using AI” with “using computers”

    When cloud computing was a new, cool buzzword thrown around that no one understood, a shortcut was suggested whether it is the right solution:

    In any sentence, replace “in the cloud” with “on another person’s computer”.

    “Computing on the cloud” becomes “computing on another person’s computer”.
    “I backup my data to the cloud” becomes “backup to another person’s computer”.
    This makes it easier to weigh benefits – they provide more space, and provide maintenance, against drawbacks – they have your data and fully control the computer it sits on.

    Today, “AI” is thrown around as an all-encompassing buzzword. “Enhance your start-up with AI”, “AI helps prepare lawsuit”, “AI-written lawsuit contains mistakes”, “Fighting wildfires with the help of AI”, “Get data insights with AI”.

    Is there a similar shortcut that clarifies thinking?

    To expose overuse of the term “using AI” without meaning, I propose to replace it with “using computers”: “Enhance your start-up with computers”, “Using computers helps prepare lawsuit”, “Computer-written lawsuit contains mistakes”, “Fighting wildfires with the help of computers”, “Get data insights with computers”.

    This makes a few things clear: First, there are benefits to using computers because of their automatic data processing. This is not new with AI. Secondly, the replacement is effective at stripping away the mythical meaning of “AI” as an independent actor, removing the possibility to delegate ownership to it. Saying “my computer did it” sounds today much sillier than “my AI did it”.

    So, replace “using AI” with “using computers”. It reveals to you how little the statement by itself tells you.

    To seriously talk about AI, we have to unpack the term. In general terms, we are talking about methods that expand their capabilities with increasing data. Therefore to judge whether AI is good or not for an application, we need to find out:

    1. Where do the data come from, who made them?
      • Question 1 leads you to problematic biases in the training data that the AI inherits. It can also reveal copyright issues and whether the data producers are fairly compensated.
    2. By what performance metric do the claimants want to be judged?
      • Question 2 reveals what people value, and whether this aligns with your values.
    3. Is the performance better in that metric than the current method?
      • Question 3 reveals whether there was an improvement made so far, and may help distinguish vaporware from genuine improvement. The baseline may be another AI method, for example comparing LLMs to Markov Chains trivially reveals how much better LLMs are. Only very few analyses truly lack a baseline.

    Note that I did not include “what is the model?” – this is the least important technical detail.

    Questions 1) and 3) are often not made by the claimants, but reused. This is often not or extremely briefly described, reflecting how much time the AI developers spent on it. These three questions are essential for putting the AI claim into context.

    Some cop-outs:

    • If only similar performance is achieved, the AI developers often point to improvements in processing time, which should be added to the performance metric answer of question 2. It’s a valid goal to achieve somewhat comparable performance at much faster speed.
    • My pet peeve cop-out is “it has potential for improvement in the future.” This may be technically true, because models might learn with more training data. However, at least in a scientific and policy context a opportunity for critically and objectively examining the outcome, in context of the historical baseline, is being skipped.

    Demand from AI news articles to know the data origin, performance metric, and historic baseline.

    If they don’t give that information, replace “using AI” with “using computers.”

  • The hero of your story

    If you try confronting wrong behaviour, you are in trouble. When people hear they did something wrong, their mind first goes into the question of whether they are a malicious actor, then immediately rejects that idea as unfathomable, then rejects anything else you say as coming from a unreliable source.

    Understanding and working with the narrator

    In our minds, we are the hero of our story. Standing for truth, culture and goodness, treating others well. Osama bin Laden probably thought he is a hero defending his country, family and way of life first against the Russians and then the Americans. Maria Theresa thought she did well when sitting with those suffering instead of treating them, as those most suffering are most blessed.

    But how can you tell whether you are a good person? For starters, I find that good people do no think of themselves as good people. They think: I can do this better, there is still this issue to resolve, I’m not as nice as I could be. Bad people think: I’m good enough and if others have a problem, it’s their problem (and they can keep it to themselves). Our minds like to tell that we are the hero of our story.

    So how to work with others – and yourself – given these limitations of what our minds will accept as input?

    Working with the narrator

    When approaching others, it is best to first describe the problem you are facing, and how it affects you. People like to solve problems. Discuss how a situation is unfair – fairness is a good common interest. Seek common ground. Discuss aligned interests, and larger problems issues both of you face together. Avoid attacking holy cows and the identity of the other person. Instead, discuss behavior, its impact, and make a small suggestion how it could be different.

    In many cases, this does not work, at least not on the first try. Habits are too engrained to be changed at once by willpower.

    But it might surprise you how much people think about small criticisms. In that case, the story of wanting to be the hero can work in your favor.

    For myself, a guideline has been Kantian principle – treat others so that if everyone treated everyone else like this, would it be a good world? When I notice that I am starting to argue for exceptions for my actions … I should really rethink my actions.

    Questioning the framework

    In western culture, a mythical narrative is that of the knight, single-handedly facing a powerful enemy, and against all odds, defeating them.

    That narrative is reflected in many movies as well. While it might be motivational, it is also problematic: It promotes selfish and self-crediting behavior, downplaying the credit of others (who gave you that sword?). It makes others helpless non-actors that must be saved, and demands that they give thanks to the hero. It is really not the collaborative approach of modern work culture requiring a team effort of complementary strengths.

    A further problematic aspect is that of self-sacrifice in the final struggle. It is quite absurd, how Hollywood movies regularly let the hero destroy their enemies. If they also succumb, they are celebrated solemnly as having done the right thing. At the same time, western culture finds Islamic suicide bombers gross and uncultured. Self-sacrifice is expected in many work places to the point of burnout, and expected of mothers (but not fathers) – mothers having hobbies or interests besides their children raises eyebrows.

    Questioning narrative frameworks, especially deeply engrained ones, is difficult, and requires a equally captive story and repetition. Rational thought alone won’t do.

    Another approach to destroying frameworks is to abuse them into comical absurdity. Short-term life hack for women: Create mini-missions for a man in your life and tell them that if they accomplish the victory they are your hero.

  • Publication time in astronomy vs statistics

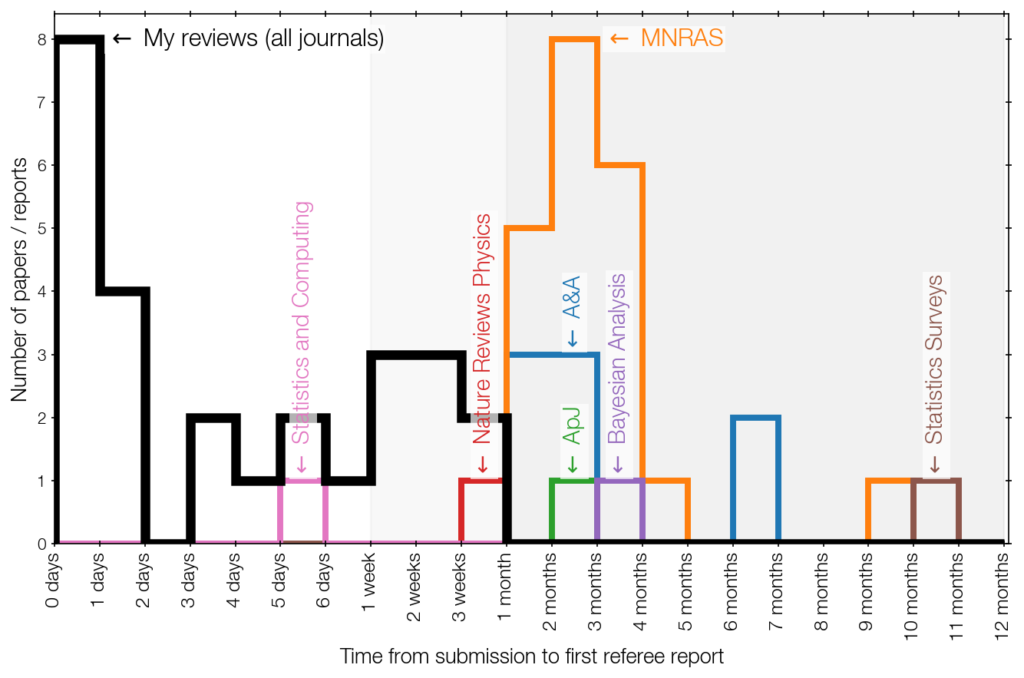
    After submitting a paper to an astronomy journal like MNRAS, ApJ, A&A, PASP it is quite typical to receive a referee report within 1-2 months.

    A search of my emails confirms this – green, orange, blue histograms are astronomy journals:

    For statistics journals, the waiting times can be much longer in my experience. For Statistics Surveys, and another paper not shown in the above, I waited for almost a year! That’s quite a shocking cultural difference. What do statisticians do all day?

    I also plotted in black how long I take between receiving a request for reviewing and submitting the review. I typically do it on the same day or the next.

    I am apparently not a typical reviewer!

    Oh – this might be a way to identify me as your reviewer 🙂

    (more…)
  • The top and bottom halves of data analysis in astrophysics

    There are two approaches to analysing data, which I will call the bottom and top half.

    Bottom half

    Look at images and data by eye. Discover anomalies and outliers. Argue primarily qualitatively. Potentially preprocess the anomaly-finding with machine learning.

    It’s a good approach for junior scientists to start looking at data (a) and understand its artifacts and limitations. However, the by-eye approach does not permit quantifying false positives and false negatives.

    The bottom half brought us the hunt for high-redshift galaxies and quasars, reddened quasars, the most luminous galaxy, the most massive black hole, Voorwerpjen, etc. etc.

    The bottom half is great for discovery of extremes by appearance.

    The bottom half approach can only search across data space, not by physical parameters. After discovery, to get physical information for the discovered system, one then switches to another type of analysis.

    Top half

    Use a physical model to fit data. Build a model that can explain the data. Quantify, including the uncertainties. Distinguish two competing physical processes.

    This can be achieved with (hierarchical) Bayesian models combined with advanced inference engines (nested sampling and dynamic Hamiltonian Monte Carlo), and more recently, perhaps, with simulation-based inference.

    Combining both halves

    Some research projects can use only the bottom half, discover something and argue qualitatively. It’s somewhat quite easy to do this: You just project the data into one or two dimensions – for example looking at color – and start visually inspecting the extremes. Slightly fancier versions, but conceptually the same, are to look at a latent space, for example produced by UMAP (or the older T-SNE), or an auto-encoder. These latent spaces are usually meaningless themselves, and randomly oriented so that a retraining gives something completely different. I’ve seen many researchers get lost in over-interpreting the shapes in latent spaces.

    To go beyond discovery and qualitative existence proofs, one needs the other half: An approach that models the demographics, placing the extremes in context, and connecting the physical space to the data space with a physically meaningful model.

    Admittedly, I call this bottom and top half to make myself and my focus on the top half feel superior. However, the top half can also not exist without the bottom half: You cannot do a blind, automated model fitting without investigating data artifacts, and careful validity checks. You need detailed analyses of individual, nearby galaxies to understand surveys of the distant Universe. So only the two halves make a whole.

  • Reliability

    Three decades ago, the word was “four nines”.

    Internet providers and company server administrators would take pride to deliver a service that was working 99.99% (four nines) or 99.999% of the time,. In German and Swiss culture, reliability is highly valued and this has been a differentiating factor, for example for automobiles and watches. Chains such as Starbucks largely build on your feeling of security of knowing exactly what you will get if you enter.

    Removing uncertainty from an uncertain life has value.

    A bit after the 2000s, reliability stopped being a focus for software services. Github, a key infrastructure component for many people to the point that people stop working when Github is down, does not promise four nines or make any reliability commitments. From EU, US to Chinese markets, towards the latter it is much more acceptable to customers that exciting new software is comes with bugs that need to be ironed out later. This results in quicker delivery timelines and innovation.

    So it is not necessarily a bad thing that it has become more acceptable that software and software services are unreliable. Building reliability takes continuous optimization over time and focused effort. The trade-off of reliability is dynamic adaptation to new markets and changed situations.

    Say for example a colleague sent you a file and its not quite the format that you can use. You write that short script or command line command (sed, awk) once, use it, verify that the output works, and never use that script again. You will not get exactly the same file format again. You do not need to support all possible variations of file formats that might arrive in the future.

    Data pipelines in research are much like this. It took me time to stop building generic multi-purpose frameworks. Most software developed in research projects is ad-hoc data transformations. By definition, research deals with something new. For the specific project, you mangle data from one form to another. You verify that it is all correct. The data pipeline specific to the project will likely not be reused in exactly the same way for the next project, because the next project is different, the exact form of the input or output, or the validity considerations will not be the same.

    Now elements of the script may be reused. We identify the commonalities. If many scientific projects benefit, the community rarely but surely invests into building a reliable, reusable data reduction pipeline. The process to get there is non-transparent and messy, but some truly impressive pipelines exist that qualify for four nines.

    For machine learning-based projects, reliability is both in and out of fashion. In principle, the starting point is great: Projects start by defining a metric to optimize (loss function). That is already a great exercise for defining what you care about, which is often otherwise left unspoken. That said, many AI-based research presentations leave me with the question: “Does it work?” and “Can I rely on it?”. Often the answer is no, formulated by the authors positively as “not yet”, and more specifically, with the phrase: “While it is not yet as good as previous approaches, our machine learning approach has the potential to outperform these in the future.” There is value in trying new approaches and it requires effort, often not achievable in a single 3-9 month project cycle. Maybe this is due to my cultural background, but I think we can be more ambitious on the standard we set for ourselves.

    You can see the lack of reliability also in a very basic metric: uptake. How many people use an AI-based tool productively? If it is not reliable enough, this will show up as a lack of citations.

    People might still talk about software that is not useful. On the one hand, this may be AI hype specific to a particular technique. This has also existed before. On the other hand, it may be genuine interest in a project in the future may opens a new type of analysis that has been accessible before. This is how new technology has always evolved – rather than improving established ways of achieving goals, focus on how new technology enables achieving different and new goals that could not be considered before.

    Despite being less visible, four nines are still important for non-customer facing backend software, but also for customer-facing software. If you want to dictate your email to your computer, or command a device, what error rate would be acceptable to you? If even 1-2 out of 100 sentences is wrong, and you have to work around the errors, the illusion of a smooth human-computer interface is broken. Take-up on voice-control is poor because it is more frustrating than a 100% reliability keyboard.

    For chat-based LLMs and AI agents, the threshold we accept seem to be astonishing low. You might get a useful answer only 20% of the time, but when it works the rush of excitement is enough to keep you going. The randomization is addictive, feeling like being at a slot machine for programmers. That said, makers of LLM optimize for exactly these performance reliability metrics, so we are seeing continuous improvements. The data driven approach means the reliability potentially reachable is certainly limited by the amount and purity of training data. The ceiling for reliability is, essentially, unknown.